Market overview · 2026 Q2
Housing market
Flat prices, rents, sales and mortgage rates against their own history.
The market in brief
Prices of old flats in blocks of flats in Finland are 18% below their peak (2022 Q2). Over the year prices have fallen 5% (2026 Q2). From 2015 to 2025 prices changed -1.8% while consumer prices rose 23%. Adjusted for inflation, flats became 20% cheaper.
The average rate on new mortgages is 3.24% (August 2026), the highest since November 2024. Since 2000 the rate has been lower in 67% of months. Sales of old flats in blocks of flats in 2025 were 3% below the 2015–2024 average. Since 2015 rents on new non-subsidised leases have risen 12% and flat prices have fallen 5%.
Key figures: Finland
Prices 2026 Q2
- Price
- €2,718/m²
- -5.0% over a year
- old flats in blocks of flats, 2025 Q3–2026 Q2
- From the peak
- -18.2%
- peak 2022 Q2
- Rent
- €16.84/m²
- +12.1% since 2015
- new leases, per month
- Sales
- 43,109
- -2.9% against the average
- old flats in blocks of flats in 2025
- 10-year average44,410
- Price-to-rent ratio
- 13.5 yrs
- price in years of rent
- Mortgage rate
- 3.24%
- a year ago 2.77%
- new loans, August 2026
- Average since 20002.75%
Mortgage rate
At this rate the monthly payment on a €200,000 25-year annuity loan is €974. At the lowest rate (0.73%) it was €730.
Monthly, January 2000 to August 2026. Source: ECB statistics.
- Now, 3.24%
- €974/month
- Lowest, 0.73%
- €730/month
- November 2020
- Average, 2.75%
- €923/month
- Highest, 6.64%
- €1,368/month
- October 2000
Monthly payment on a €200,000 loan over 25 years, annuity.
What holding periods have returned
Of all 5-year periods starting from 1988, prices rose in 79%. The worst was 1989 Q3 to 1994 Q3: -35.5%.
Bought 2021 Q2: -17.4% over 5 years
One dot for every quarter in which the flat could have been bought (1988 at the top, the newest at the bottom). Source: Statistics Finland, price index.
- 1 years
- 68%
- rose · worst -19.7%
- 3 years
- 78%
- rose · worst -38.3%
- 5 years
- 79%
- rose · worst -35.5%
- 10 years
- 91%
- rose · worst -10.2%
Prices by area
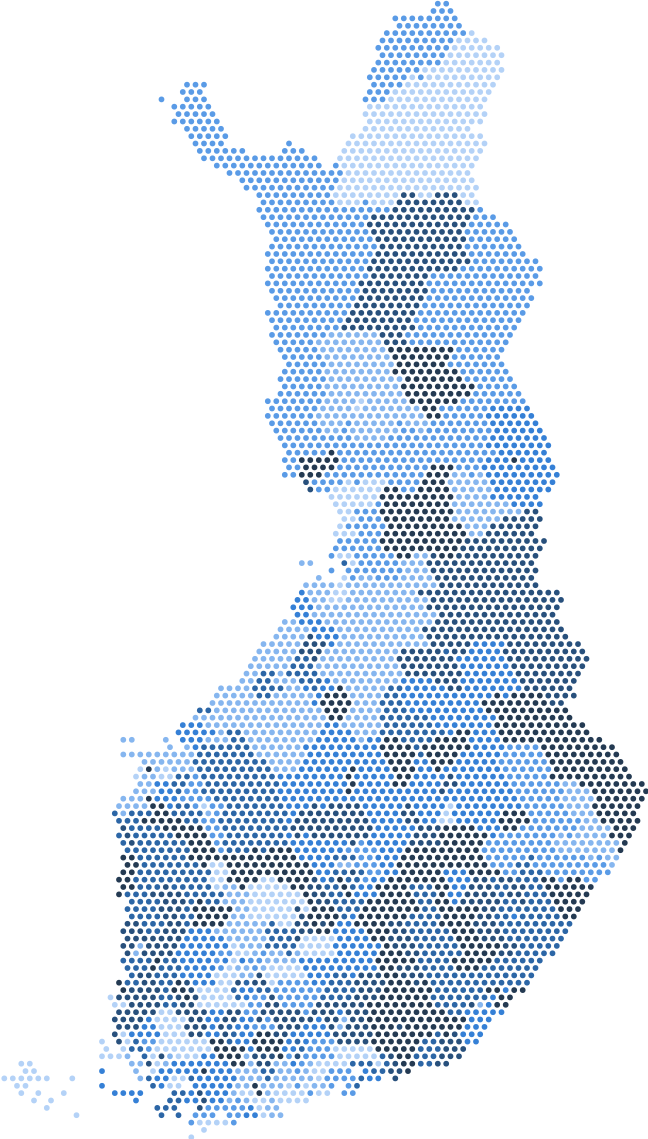
In 26 of 27 cities prices are more than 10% below their own peak. Furthest from its peak is Mikkeli: -43.6%.
Search for a municipality or pick it on the map.
Furthest from their peak among the cities with area pages
Municipalities without a price index of their own show their region. Source: Statistics Finland.
Your area
Search for any municipality, region or postal code area.
Popular
Key figures: Helsinki
Prices are 19.6% below their peak (2022 Q2). Over the year prices have fallen 4.7% (Finland -5.0%). Sales in 2025 were 8.2% below the 2015–2024 average. Since 2015 rents have risen 9.7% and prices 6.0%.
- Price
- €5,046/m²
- -4.7% over a year
- old flats in blocks of flats, 2025 Q3–2026 Q2
- Finland€2,718/m²
- From the peak
- -19.6%
- peak 2022 Q2
- Finland-18.2%
- Rent
- €21.88/m²
- +9.7% since 2015
- new leases, per month
- Finland€16.84/m²
- Sales
- 9,211
- -8.2% against the average
- old flats in blocks of flats in 2025
- 10-year average10,031
- Price-to-rent ratio
- 19.2 yrs
- price in years of rent
- Finland13.5 yrs
2015 = 100, quarterly, 1988 to 2026 Q2. Source: Statistics Finland.
9,211 sales in 2025
Yearly, 2006 to 2025; the dashed line is the 2015–2024 average. Source: Statistics Finland.
2015 = 100. Rents: new non-subsidised leases, changes chained across the 2025 revision of the series. Source: Statistics Finland.
Bought 2021 Q2: -18.7% over 5 years
One dot for every quarter in which the flat could have been bought (1988 at the top, the newest at the bottom). Source: Statistics Finland, price index.
What the coming years could bring
How much would you have after 5 or 10 years if prices or the mortgage rate moved as they once did? Each case changes one assumption. These are not forecasts.
The example flat
One-bedroom flat, 55 m², 00100 Helsinki keskusta - Etu-Töölö
- Price
- €394,185
- Rent
- €1,367/month
- Housing company charge
- €324/month
- Right of occupancy
- fee €59,128, charge €1,162/month
- Mortgage
- 20% down, 3.22%, 25 years
- Return on savings
- 2.5% a year, in a savings account
- Default growth
- prices +1.7%, rents +2.1% a year
Price paths: price index of Helsinki 1, the index the calculator uses for this flat
Prices
Mortgage rate
Combined
The calculator's defaults
Prices change +1.7% a year, the area's average over the last 10 years, and the mortgage rate stays at 3.22%, today's rate on new mortgages.
Wealth by year
BuyRight of occupancyRent- Buy
- €141,025
- Right of occupancy
- €140,480
- Rent
- €130,211
Wealth after 5 years
Best: Buy, €545 more than the next best. With these assumptions buying overtakes renting in year 4.
How the calculation works
- 1.The buyer, the renter and the right-of-occupancy resident start with the same savings.
- 2.Each month all three spend the same amount. Whoever pays less for housing saves the rest.
- 3.Wealth at the end is what each would have left: for the buyer the flat less the loan, costs and tax, for the others their savings and the refunded fee.
- 4.A price path repeats its period's average yearly change every year. Everything else is the calculator's default.
Start with your own area
Search the map for an address or postal code, read about a neighbourhood or start with the guides.