Updated 5 October 2026
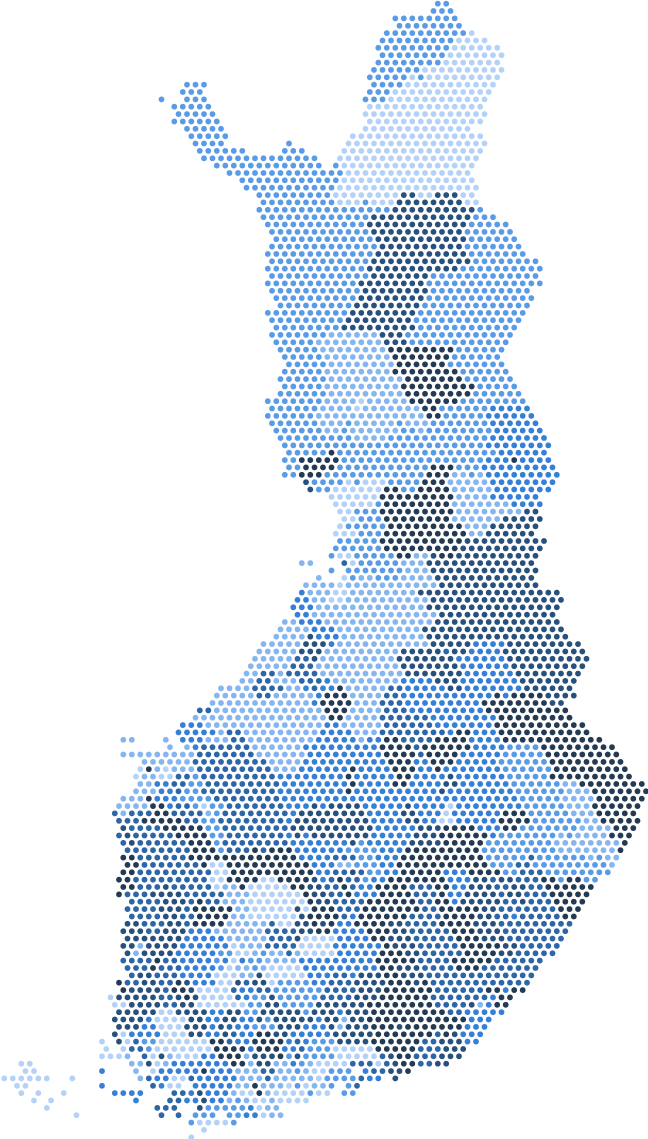
On the Asumisvalinta map you can colour the postal code areas by the price-to-rent ratio. The number answers a simple question: how many years of rent does the price of a flat equal?
How it is calculated
The price-to-rent ratio is the price per m² divided by a year of rent per m²:
price-to-rent ratio = price per m² ÷ (monthly rent per m² × 12)
If the price is €4,800 per m² and the rent €20 per m² a month, a year of rent comes to €240 per m². The price then equals 20 years of rent.
On the map both figures are the latest from Statistics Finland: the price per m² of old flats in housing companies and the rent per m² of new free-market leases. The ratio is calculated separately for studios, one-bedroom flats and flats with two or more bedrooms.
How to read it
- A high ratio means flats are expensive compared with rents. Renting is then relatively cheaper.
- A low ratio means flats are cheap compared with rents. Buying is then relatively cheaper.
Its inverse is the gross rental yield: a year of rent as a percentage of the price. A ratio of 20 equals a gross yield of 5%, a ratio of 25 a yield of 4%.
The ratio works best for comparing areas with each other. When two areas differ clearly, the difference shows where buying is more expensive relative to renting.
What it leaves out
The price-to-rent ratio is a rough measure. It does not include:
- maintenance and finance charges that the owner pays
- loan interest, or what your own money could earn elsewhere
- transfer tax, selling costs and taxes
- renovations that the owner pays
- how prices and rents will develop
- differences between individual flats, such as condition, year built and location within the area.
The gross rental yield is therefore not an investor's net return, and a low ratio alone does not mean that buying is right for you.
Hatched areas
When no figure has been published for a postal code area, the map uses the figure of a larger area: the price sub-area, the municipality, the region or the whole country. These areas are hatched on the map, and clicking one shows which level the figure comes from.
Next step
To see what buying, renting and right of occupancy cost you, use the comparison. It includes charges, the loan, taxes and price changes, year by year.
Sources
- Prices of old dwellings in housing companies, Statistics Finland: prices per m² by postal code area.
- Rents of dwellings, Statistics Finland: rents per m² of new free-market leases.
- Methodology, Asumisvalinta: how the figures are chosen and when a larger area's figure is used.