Updated 15 October 2026
The price-to-rent ratio tells how many years of rent the price of a flat equals. This guide compares it across Finland's largest cities and their sub-areas with the latest figures from Statistics Finland. How the ratio is calculated and what it leaves out is explained in how to read the price-to-rent ratio.
Cities ranked
From July 2025 to June 2026, an old flat in a block of flats cost 13.5 years of rent on average in the whole country. The gross rental yield was 7.4%.
Price-to-rent ratio by cityHow many years of rent a flat costs, 2025Q3 – 2026Q2
Helsinki
- Price
- €5,046 / m²
- Rent
- €21.88 / m² a month
- Gross yield
- 5.2%
- Sales
- 8,578
| # | ||
|---|---|---|
| 1 | €5,046 · €21.88 | 19.2 |
| 2 | €3,773 · €18.75 | 16.8 |
| 3 | €3,006 · €17.55 | 14.3 |
| 4 | €2,455 · €14.46 | 14.1 |
| 5 | €2,673 · €15.86 | 14.0 |
| Whole country€2,718 · €16.84 | 13.5 | |
| 6 | €2,645 · €17.75 | 12.4 |
| 7 | €2,205 · €14.89 | 12.3 |
| 8 | €1,984 · €13.68 | 12.1 |
| 9 | €2,006 · €14.55 | 11.5 |
| 10 | €1,998 · €14.91 | 11.2 |
Old flats in blocks of flats, 2025Q3 – 2026Q2: average price per m² weighted by sales and average rent per m² of new non-subsidised leases weighted by leases. 2026 prices are preliminary. Source: Statistics Finland (CC BY 4.0).
- The highest ratio was in Helsinki, 19.2 years. Next came Espoo and Kauniainen (16.8), Tampere (14.3), Porvoo (14.1) and Turku (14.0).
- The lowest ratio was in Kouvola, 5.8 years. It was 6.8 in Kotka and 7.2 in Kajaani.
- A flat in Helsinki cost more than three times as many years of rent as one in Kouvola. The rent per m² in Helsinki was about twice Kouvola's, and the price per m² more than six times.
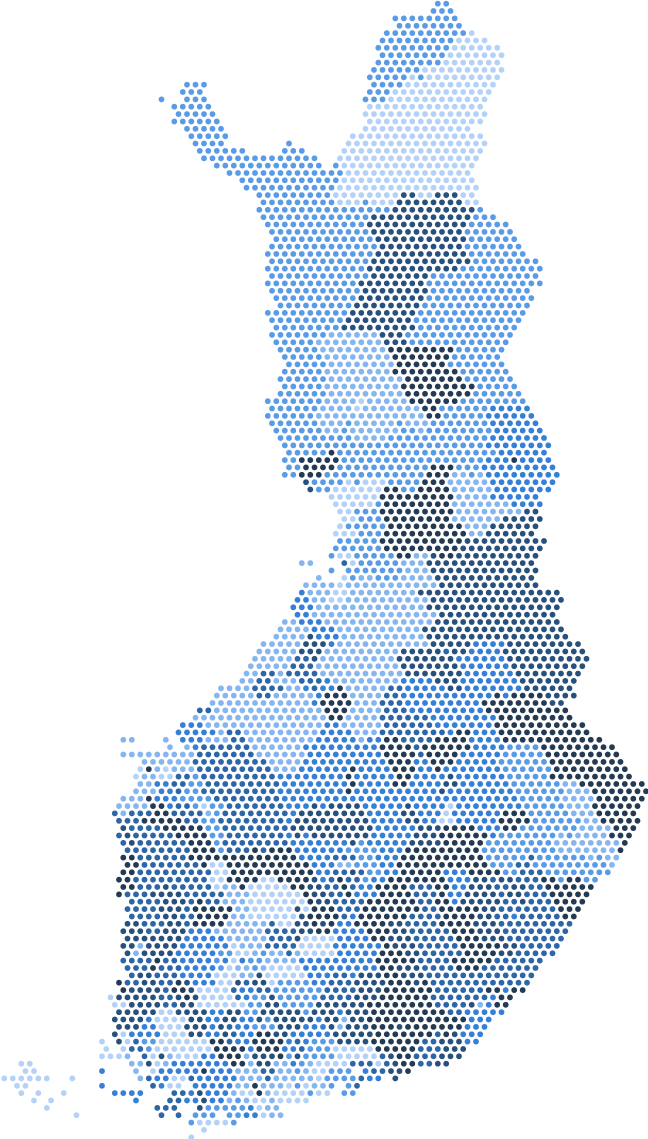
The table sorts by any column. Point at a city to see it on the map with its price, rent, gross yield and number of sales.
Flat size
The ratio is lowest for studios and highest for flats with two or more bedrooms. Studios have a clearly higher rent per m² than larger flats, and the gap is wider than in prices.
- In the whole country, a studio cost 12.0 years of rent, a one-bedroom flat 12.9 and a flat with two or more bedrooms 15.4.
- In Helsinki the figures were 17.3, 19.0 and 21.1 years.
Switch the flat size above the table. Smaller cities lack some sizes because too few flats of that size were sold or let.
From the centre to the suburbs
Statistics Finland groups the postal code areas of 15 large cities into sub-areas by price level and location. In every city the ratio was highest in sub-area 1, where prices are highest.
From the centre to the suburbsPrice-to-rent ratio by sub-area, all flat sizes
Highest · Helsinki 1
Lowest · Helsinki 4
Statistics Finland groups the postal code areas of each large city into sub-areas by price level and location; sub-area 1 has the highest prices. Examples are the postal code areas with the most sales in 2025. Old flats in blocks of flats, 2025Q3 – 2026Q2: average price per m² weighted by sales and average rent per m² of new non-subsidised leases weighted by leases. 2026 prices are preliminary. Source: Statistics Finland (CC BY 4.0).
- In Helsinki sub-area 1, which includes the city centre, Kamppi and Punavuori, a flat cost 25.0 years of rent. In sub-area 4, which includes Kontula, Pihlajamäki and Kannelmäki, the figure was 12.0.
- Turku had the widest relative gap: 17.4 years in sub-area 1 and only 7.4 in sub-area 3.
- In Tampere the figures were 16.6 and 10.2 years.
Expensive areas are therefore expensive relative to rents as well. A city average says little about a single area, so compare postal code areas on the map.
The ratio since 2015
The longer series comes from older Statistics Finland tables, where rents cover all leases. Its levels differ from the figures above, so read it for the trend.
The ratio since 2015Years of rent, all flat sizes, yearly
HelsinkiMedian of the citiesOther cities- 2015
21.121.1 - Peak, 2021
23.223.2 - 2025
19.619.6
Average price per m² of old flats in blocks of flats by municipality and average rent per m² of all non-subsidised leases (the 2015-based rent series, discontinued in 2026). The levels are not comparable with the figures above. Espoo is left out because its price and rent areas differ. Source: Statistics Finland (CC BY 4.0).
- In Helsinki the ratio rose from 21.1 years in 2015 to a peak of 23.2 in 2021 and fell to 19.6 in 2025.
- The median of the cities fell from 13.9 to 11.1 years.
- From 2021 to 2025, the average price per m² in Helsinki fell by about 12.5% while the rent per m² rose by about 3.5%. In Tampere the price fell by about 5.5% and the rent rose by about 10%.
What the ratio tells a buyer
A high ratio means renting is cheap relative to prices. A low ratio means buying is cheap relative to rents. The ratio leaves out charges, loan interest, taxes, renovations and future price changes, so on its own it does not tell which option suits you.
The comparison includes all of these, year by year, for the flat you choose.
How the figures are calculated
- Prices: average price per m² of old flats in housing companies in blocks of flats, the latest four quarters (July 2025 to June 2026), weighted by the number of sales. 2026 figures are preliminary.
- Rents: average rent per m² of new non-subsidised leases in the same quarters, weighted by the number of leases.
- Ratio: price per m² divided by a year of rent per m². A city is included when both its price and its rent are published for every quarter.
- Series since 2015: yearly price per m² of old flats in blocks of flats by municipality, and rent per m² of all non-subsidised leases from the 2015-based rent series, which Statistics Finland discontinued in 2026. Espoo is left out because its price figures cover Espoo alone and its rent figures include Kauniainen.
- The map uses the latest quarter for each postal code area, so its figures can differ from this guide.
Sources
- Prices of old dwellings in housing companies, Statistics Finland: prices per m² and numbers of sales by area and by municipality.
- Rents of dwellings, Statistics Finland: rents per m² of new leases by area and the 2015-based rent series.
- Methodology, Asumisvalinta: how the figures are chosen and when a larger area's figure is used.